
Cashback websites have transformed the way consumers shop online by offering rewards that not only incentivize purchases but also foster customer loyalty.
In an increasingly competitive e-commerce landscape, these platforms have become a critical driver of consumer engagement, helping both businesses and shoppers maximize value.
From mobile adoption and personalized engagement to fraud prevention and referral systems, cashback websites provide a wealth of insights into consumer behavior and market trends.
In this article, we’re going to discuss key statistics that highlight the growth, user preferences, technological advancements, and market influence of cashback platforms across various regions and sectors.
Let’s start with the global overview
Global Cashback Industry Statistics #
- There are over 5,000 cashback websites worldwide.
- The global cashback industry has an estimated value of approximately $8 billion.
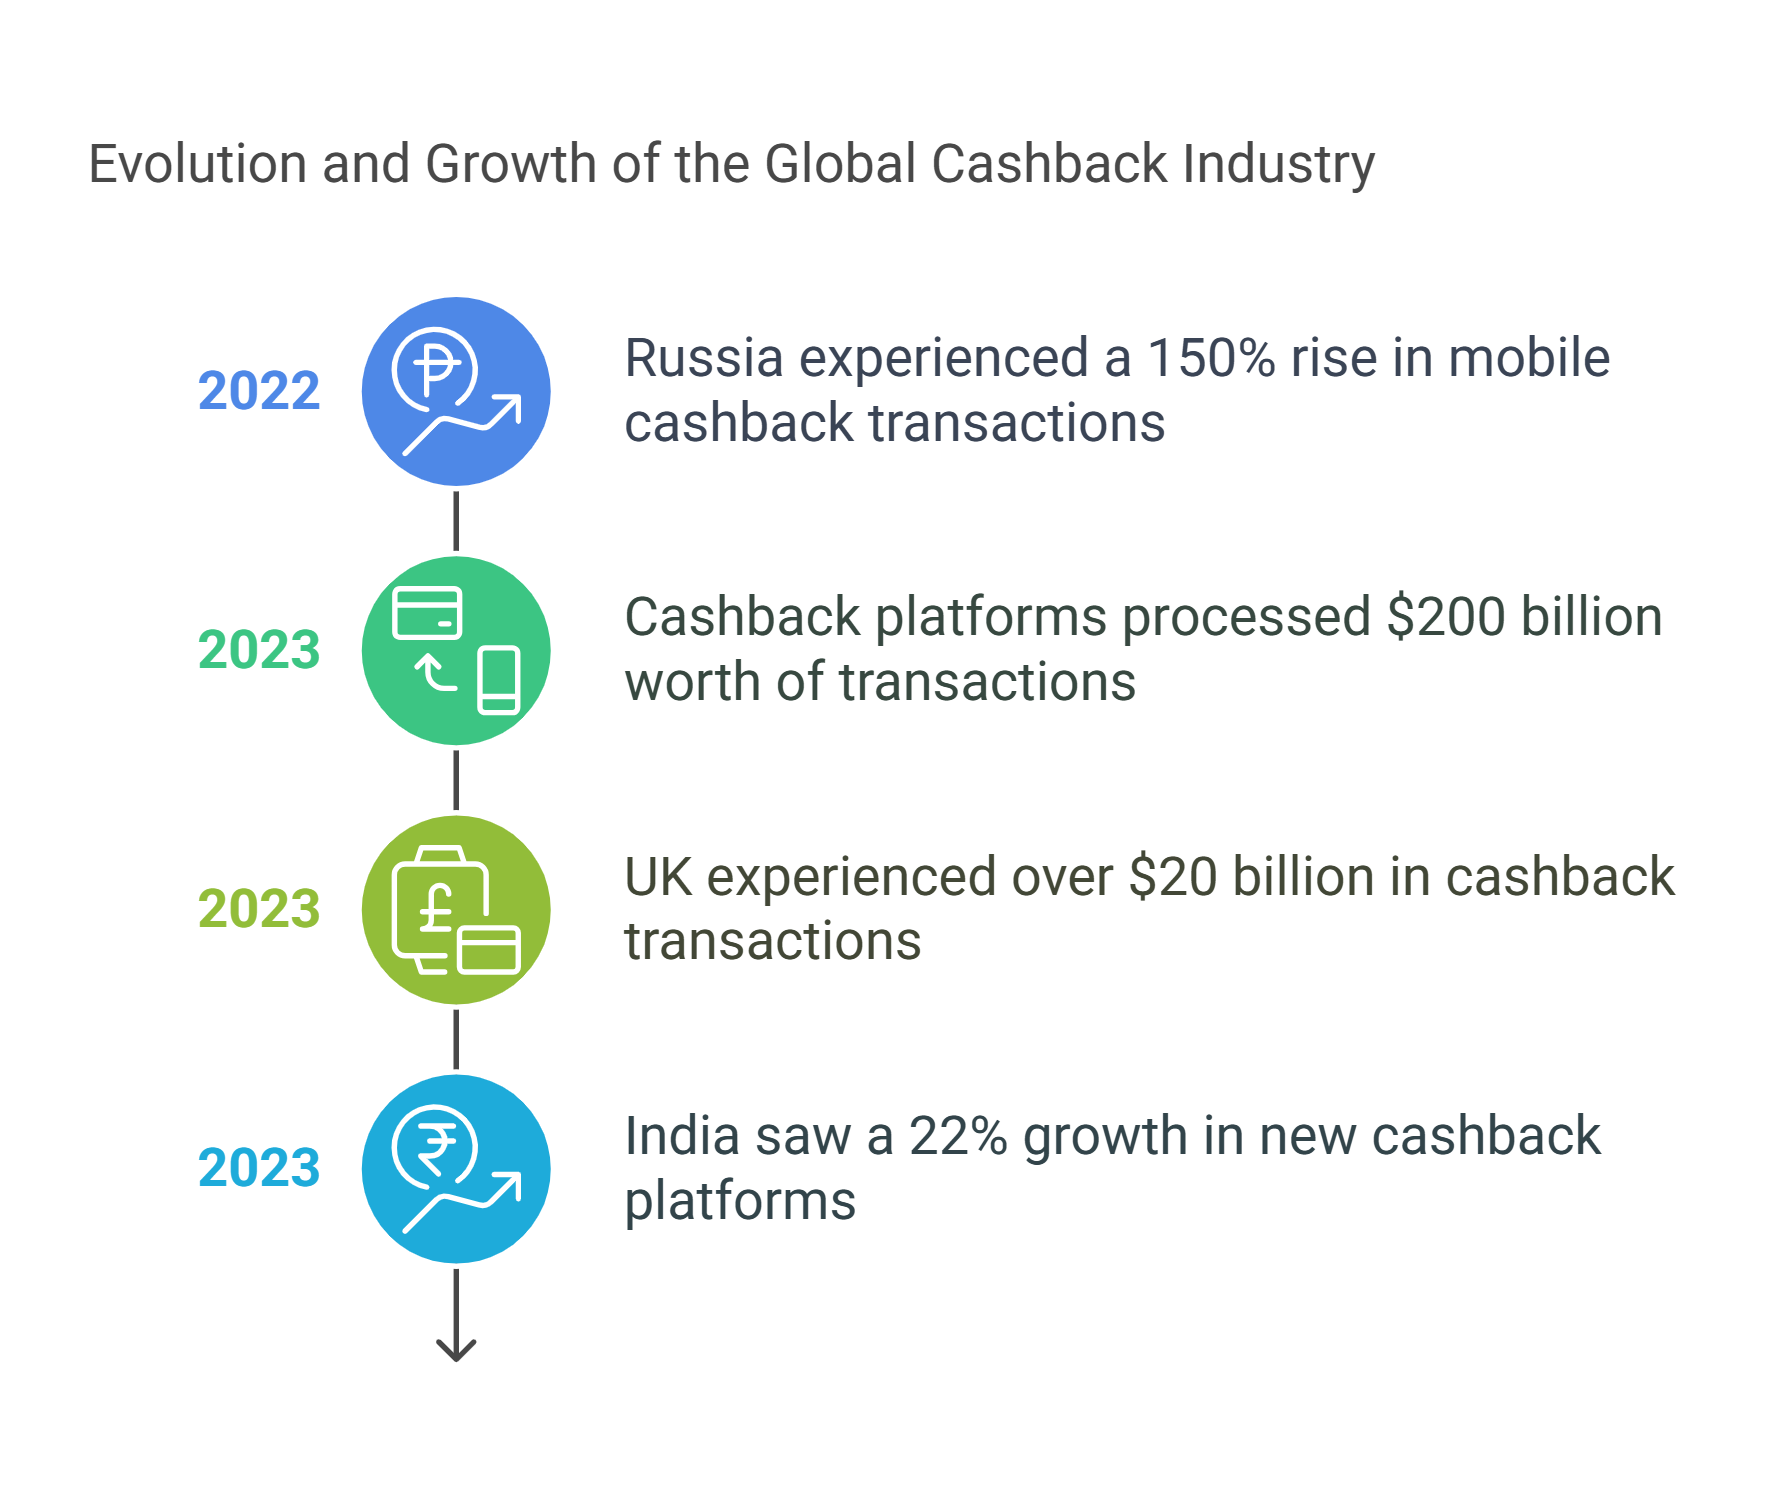
- Cashback platforms processed a staggering $200 billion worth of transactions in 2023.
- The Asia-Pacific region accounts for 40% of all cashback websites globally.
- The United States observed a 14% growth in cashback transactions during 2023.
- In Asia, China’s cashback market is the leader, valued at over $2 billion.
- Approximately 7 out of 10 online shoppers in Europe have engaged with a cashback platform.
- In 2023, India experienced a 22% growth in the number of new cashback platforms.
Regional and Key Market Leaders Statistics for Cashback Websites #
- Australian consumers collectively earned cashback rewards exceeding $100 million in the previous year.
- In South America, Brazil stands out with more than 150 cashback platforms leading the market.
- Globally, the average cashback rate is approximately 6%, showcasing consistent growth.
- A significant 65% of all cashback transactions are conducted via mobile devices, highlighting the rise of mobile commerce.
- In 2023, the UK experienced over $20 billion in transactions processed through cashback platforms.
- Major e-commerce players such as Amazon and Alibaba offer some of the most competitive cashback deals worldwide.
- The travel industry boasts the highest average cashback rate, sitting at 8% across sectors.
- More than 200 million global consumers utilized a cashback platform at least once during 2023.
Technology Integration and Sector-specific Cashback Site Statistics #
- The holiday season accounts for approximately 30% of annual cashback transactions.
- Africa’s cashback platforms experienced a 15% growth last year, with South Africa leading the region.
- Fashion and electronics sectors collectively represent over 50% of cashback transactions.
- Canada’s cashback market saw a 10% increase in 2022, surpassing $1 billion in transactions.
- Integration of loyalty programs with cashback offers boosted customer retention by 25%.
- Japan and South Korea make up 15% of the global cashback market.
- Email marketing continues to lead as the top channel for cashback websites, achieving a 40% open rate.
- Russia experienced a staggering 150% rise in mobile cashback transactions during 2022.
Growth and Market Influence of Cashback Platforms #
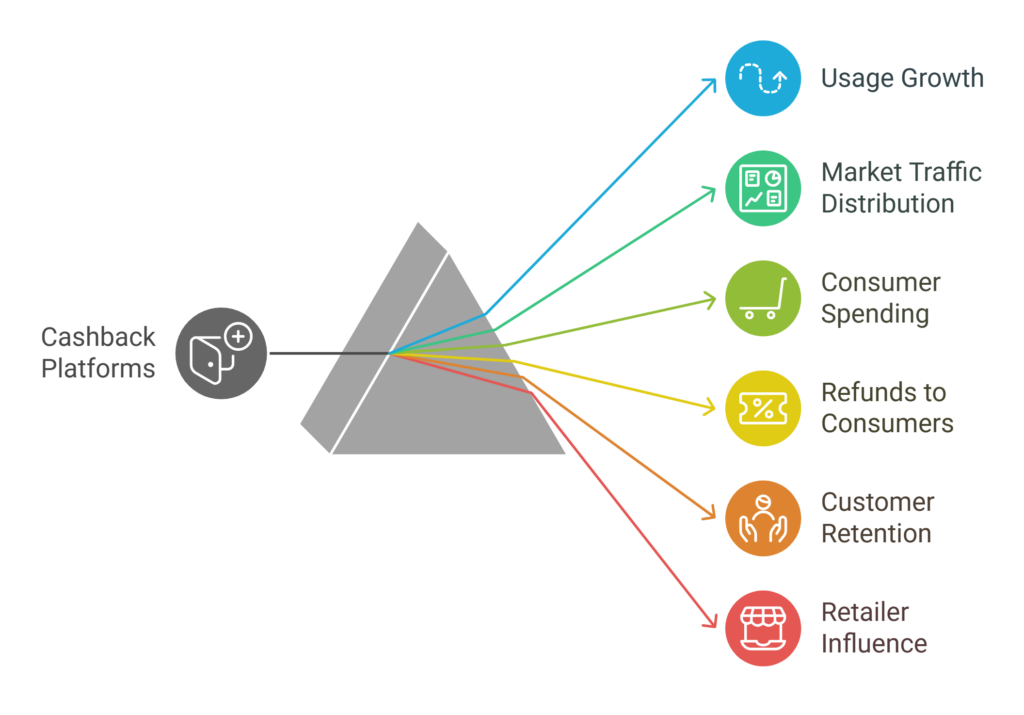
- Cashback website usage has increased by 32% over the past year.
- The top five cashback platforms contribute to 68% of total market traffic.
- On average, customers spend 18% more when using cashback portals.
- The cashback industry refunded an estimated $1.8 billion to consumers last year.
- Ecommerce businesses collaborating with top cashback platforms see a 22% increase in returning customers.
- 58% of online shoppers state that cashback offers influence their choice of retailer.
- Leading cashback websites have expanded their physical presence, with 28% offering brick-and-mortar outlets.
- The top cashback platform’s dynamic reward system enhances user engagement by 38%.
Cashback Website Fraud, and Prevention Statistics #
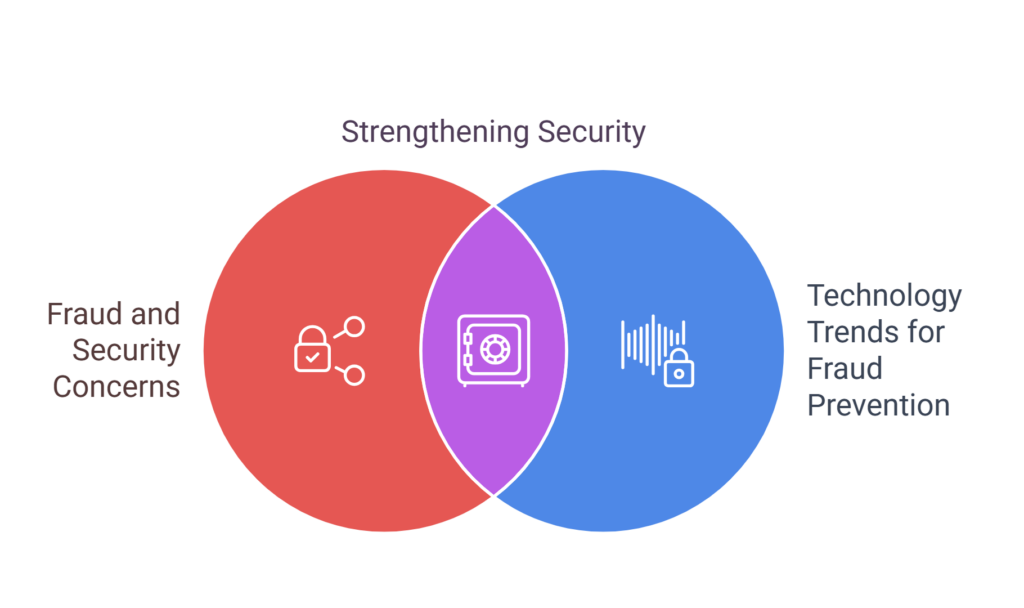
Fraud and Security Concerns in the Cashback Industry #
- Cashback platforms contribute approximately 0.6% to the global e-commerce economy.
- Retail sales driven by cashback offers increased by 12% in the last fiscal year.
- About 4% of cashback transactions exhibit inconsistencies indicating potential fraud.
- Common fraudulent activities include using stolen card details, creating multiple accounts, and falsifying purchase records.
- Leading cashback sites have implemented AI-driven fraud detection, reducing suspicious activity by 40%.
- 9 out of 10 cashback platforms now incorporate two-factor authentication for enhanced security.
- The industry reports an annual loss of $120 million due to cashback fraud.
- Fraud prevention efforts have boosted consumer trust in cashback platforms by 15%.
- Around 60% of users feel more secure with platforms that regularly update their fraud prevention strategies.
- 7 out of 10 cashback platforms have encountered at least one major security breach in the past five years.
- Enhanced fraud prevention measures have reduced financial losses in the cashback industry by 28% over the last three years.
Technology Trends for Fraud Prevention and Security in Cashback Platforms #
- The average cashback user is now 30% more likely to report suspicious activity compared to previous years.
- Fraud impact on user trust led to a 26% decline in new user registrations in 2023.
- Partnerships between cashback platforms and e-commerce sites have enhanced fraud detection by 35%.
- Cashback platforms are 25% more likely to collaborate with third-party security firms for improved safety compared to 2019.
- AI-based analytics predict a potential 5% yearly rise in fraudulent cashback activities.
- 55% of cashback users identify fraudulent behaviors as their top concern.
- Over 80% of users consider a secure and transparent redemption process vital for continued platform engagement.
- Cashback platforms that introduced real-time fraud alerts in 2023 experienced a 20% increase in user trust and engagement.
- Approximately 45% of users switched platforms due to security or fraud concerns over the past two years.
- Platforms implementing blockchain for transaction verification saw a 30% drop in fraudulent claims.
Strengthening Security: Fraud Prevention and User Awareness in Cashback Platforms #
- Fraud prevention education campaigns led by major cashback platforms have resulted in a 40% increase in user-reported suspicious activities.
- Platforms offering user training on security best practices have achieved a 25% reduction in compromised accounts.
- 70% of cashback users are willing to complete additional verification steps if it improves security.
- The introduction of biometric authentication in cashback apps has boosted user confidence by 33%, with many viewing it as a more secure alternative to traditional passwords.
Mobile Vs. Desktop Cashback Website Statistics #
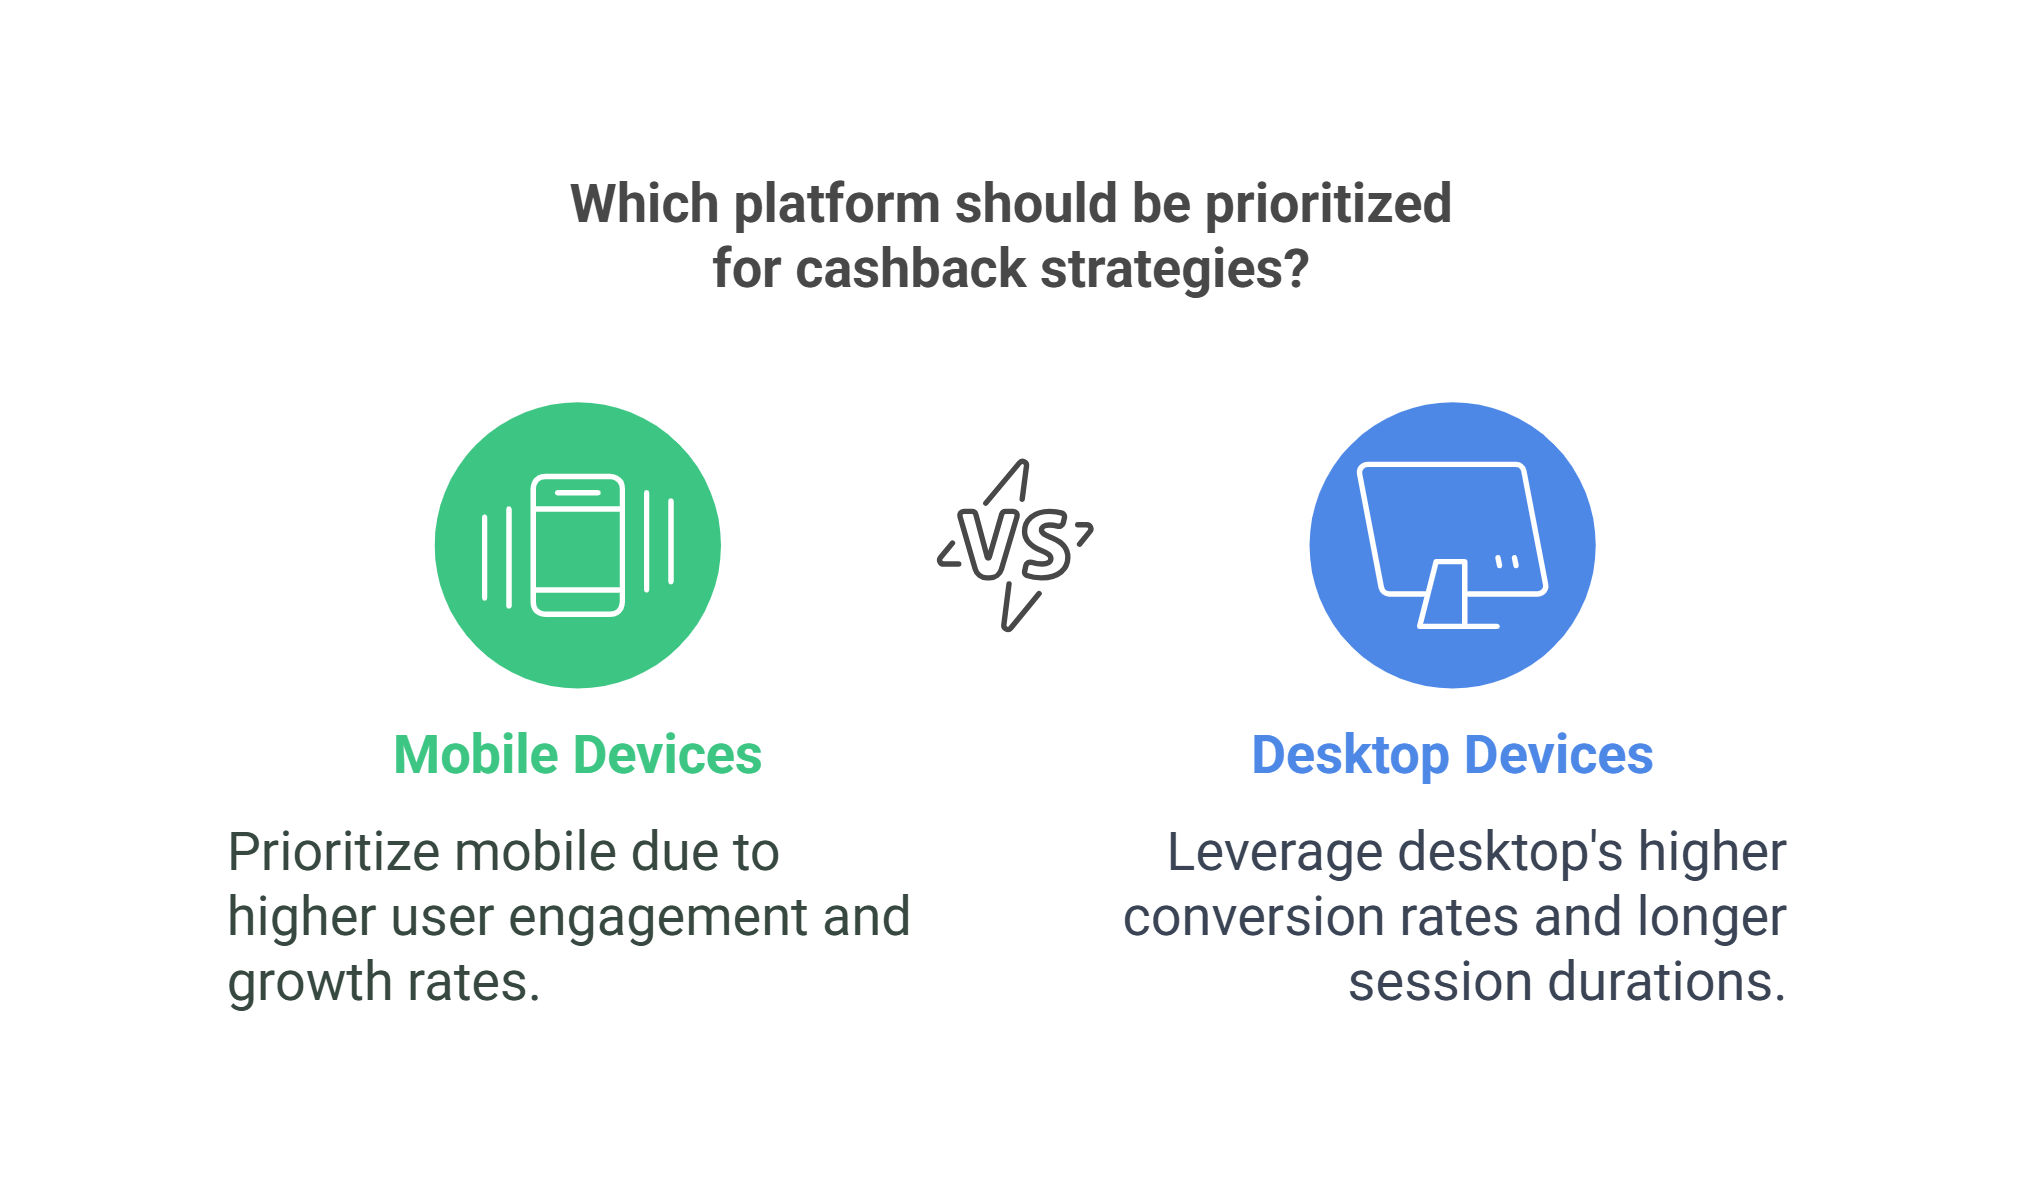
The Dominance of Mobile: Usage Trends and Engagement on Cashback Platforms #
- 78% of users access cashback websites via mobile devices.
- Desktop users account for only 22% of the total cashback website user base.
- Mobile usage on cashback websites has experienced a 15% year-on-year growth.
- Desktop usage for cashback websites dropped by 5% over the last year.
- 83% of millennials prefer accessing cashback offers through mobile devices.
- Mobile users redeem cashback offers 20% more frequently than desktop users.
- 90% of sessions on cashback websites via mobile devices last under five minutes.
- On average, desktop users spend 11 minutes per session on cashback websites.
Device Transition and User Engagement #
- 65% of users who switch devices prefer transitioning from desktop to mobile for accessing cashback offers.
- The average mobile user visits cashback websites three times a week.
- In comparison, desktop users check cashback websites only once weekly.
- Conversion rates for cashback websites on mobile devices are 8%.
- Desktops have a slightly higher conversion rate of 9.5% for cashback offers.
- 70% of users cite ease of use as the main reason for favoring mobile platforms.
- Downloads of cashback mobile apps surged by 25% last year.
Redemption Rates and Referral Trends in Cashback Platforms #
- 40% of desktop users have never redeemed a cashback offer, compared to 25% of mobile users.
- Push notifications on mobile apps lead to a 30% higher redemption rate.
- Mobile users are 15% more likely to refer friends to cashback platforms.
- Only 20% of desktop users have utilized referral systems on cashback websites.
Cashback Website Statistics: Insights into Seasonal and Time-Based User Behavior #
- Mobile devices experience a 50% higher rate of seasonal cashback offer redemptions.
- Desktop users are more likely to redeem cashback offers during traditional work hours (9 AM to 5 PM).
- 80% of nighttime redemptions (8 PM to 12 AM) are completed via mobile devices.
- Tablets contribute to 10% of mobile cashback website access.
- 55% of mobile users redeem cashback offers within 24 hours of receiving them.
- Desktop users, on average, wait 72 hours before redeeming cashback offers.
Mobile Optimization and User Engagement Trends in Cashback Platforms #
- Cashback websites with optimized mobile interfaces achieve a 12% higher user retention rate compared to those without optimization.
- 68% of users report making impulse purchases on mobile cashback platforms due to limited-time offers.
- Mobile cashback apps with integrated digital wallets enable a 35% faster redemption process compared to traditional methods.
- 45% of desktop users rely on browser extensions or plugins for cashback notifications, whereas only 15% of mobile users do the same.
- Gamified features on mobile cashback platforms, such as spin-to-win or daily check-ins, result in a 20% increase in active users.
Emerging Technologies and Personalized Engagement Statistics for Cashback Websites #
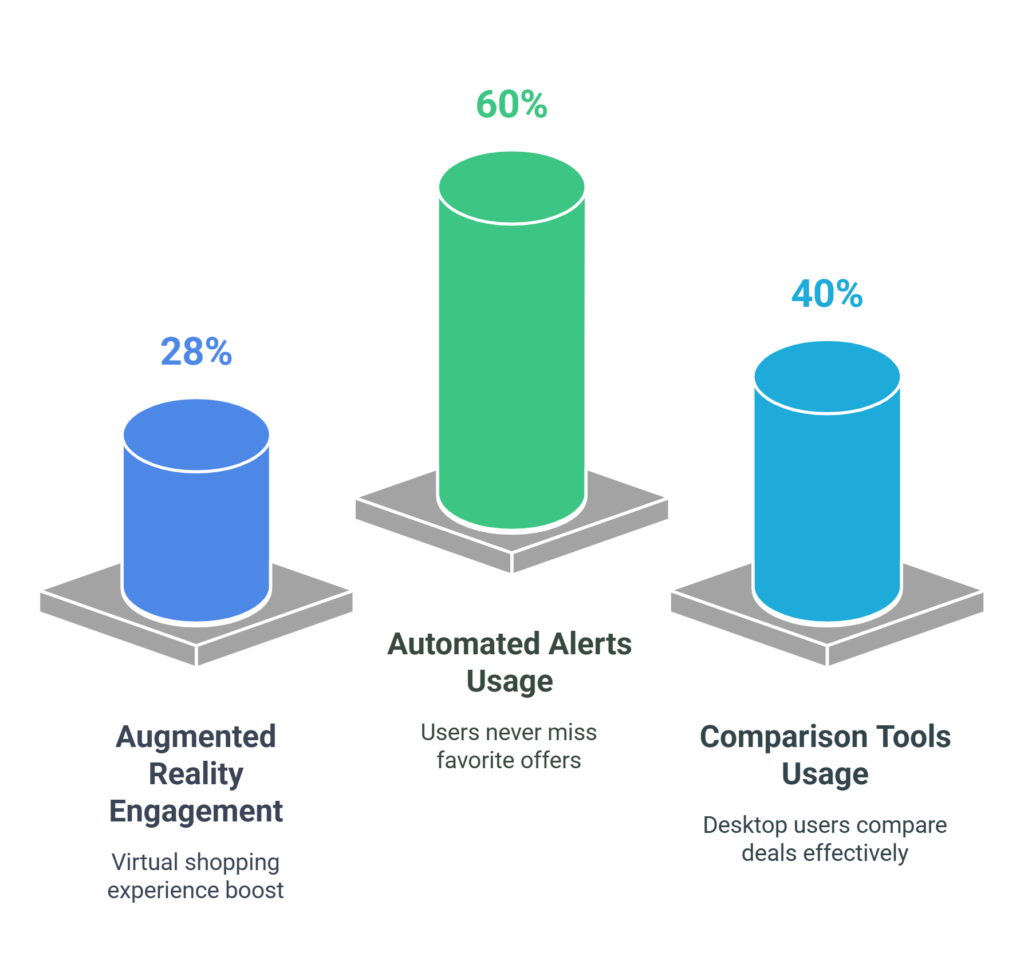
- Augmented Reality (AR) features in mobile cashback apps have resulted in a 28% increase in user engagement, as users explore virtual shopping experiences.
- 60% of mobile cashback platform users have automated alerts set for their favorite brands or categories, ensuring they never miss an offer.
- Desktop users are 40% more likely to use comparison tools on cashback websites, comparing deals across multiple retailers before purchasing.
Cashback Website Trends: Economic Influence & Affiliate Partnership Dynamics #
The Impact of Cashback Websites on Retail and Consumer Behavior #
- Cashback websites contribute to an estimated $2 billion annual increase in consumer spending.
- Retailers partnering with cashback platforms observe an average 15% growth in sales.
- Ecommerce platforms offering cashback rewards experience a 20% higher repeat purchase rate.
- 70% of consumers state they are more inclined to shop at stores that provide cashback rewards.
- Over 5,000 retailers globally have affiliate partnerships with major cashback websites.
- 80% of the top 100 online retailers include cashback offers in their sales strategies.
- Amazon, Walmart, and eBay are among the most significant retail partners in the cashback ecosystem.
- Cashback sites earn approximately 5–15% commission on each sale made through their platforms.
Cashback Websites and User Behavior #
- 90% of the commission earned by cashback sites is returned to consumers as rewards.
- 65% of users revisit the same cashback website for their subsequent purchases.
- Mobile purchases through cashback apps have experienced a 30% year-on-year growth.
- During holiday seasons, cashback sites contribute an additional 25% of sales for partnered retailers.
- 60% of cashback users are millennials, reflecting a strong trend among younger shoppers.
- Cashback platforms operate in over 50 countries, with the U.S., U.K., and China leading in user numbers.
- Regular cashback users save an average of $300 annually.
Cashback Industry Growth and User Preferences #
- The affiliate marketing industry, significantly influenced by cashback sites, is projected to reach $8 billion by 2025.
- Registrations on cashback websites have grown at an annual rate of 20%.
- Retailers partnering with cashback platforms report a 10% boost in brand awareness.
- 75% of users trust online reviews and ratings on cashback platforms.
- Over 40% of cashback deals are exclusive to these platforms and not available elsewhere.
- Cashback app users engage with their apps three times more frequently than other shopping apps.
- 25% of new users on cashback platforms are acquired through referral programs.
- Shoppers spend 20% more per transaction when using cashback offers.
The Influence of Cashback Platforms on E-Commerce and Consumer Behavior #
- Cashback sites drive 30% more traffic to e-commerce platforms during flash sales.
- 55% of online shoppers prefer shopping through platforms offering cashback rather than discount coupons.
- Websites with user-friendly interfaces and seamless navigation achieve a 25% higher user engagement rate.
- 40% of consumers say cashback rewards influence their decision to explore new brands or products.
- Cashback platforms with integrated price comparison tools experience a 30% rise in daily active users.
- 85% of users redeem their cashback rewards within the first three months of earning them.
- The beauty and personal care industry has seen a 35% sales increase via cashback websites over the past year.
- Cashback websites with loyalty programs achieve a 40% higher user retention rate compared to platforms without such features.
- 50% of users state that timely notifications about expiring deals encourage immediate purchases.
- Retailers offering tiered cashback rewards based on purchase value report a 28% increase in average order value.
Conclusion #
These statistics provide valuable insights into the growing influence of cashback websites, helping businesses and marketers understand consumer preferences, optimize engagement strategies, and maximize conversions.
By leveraging data on mobile usage, loyalty programs, and user behavior, businesses can tailor their offerings to enhance customer satisfaction and drive repeat purchases.
For consumers, these trends highlight the increasing opportunities to save and make smarter shopping decisions. Together, these insights pave the way for informed decision-making, ensuring that cashback platforms continue to thrive as a win-win solution for all.
Sources:
- FinanceBuzz
- Medium
- Marketplace
- BBC
- Entrepeneur
- Pymnts
- ScienceDirect
- Growth Market Reports
- Forbes
- Stack Exchange
- Advertise Purple
Launch your own cashback platform